Introduction
“Precision greenkeeping” requires usage of complex technological decision support tools to help greenkeepers or intendants. Soil moisture sensors are part of this tool panel for proper irrigation practices.
In practice, intendants make soil moisture measurements on a regular basis to get a mean of the whole pitch. This average is highly dependent on sampling strategy and number of measurements for each measurement set.
The aim of this article is to estimate the minimum number of measurements with the POGO Mini sensor (Hydraprobe Sensor from Stevens Water company) on hybrid football pitch to get a mean statistically representative of the whole pitch.
Material and method
The pitch used in this study is a hybrid first league stadium made of Airfibr system (technology made of fine sand, cork and synthetic fibers produced by the French company Natural Grass). It is equipped with 35 sprinklers (7×5 Hunter I40 sprinklers).
During 10 months (from June 2019 to March 2020), 64 soil moisture measurement series have been taken with the soil sensor POGO Mini. Between 20 and 105 measurements has been made for each series with a standard series of 63 measurements that I consider reliable but is time consuming for an intendent if realized daily.
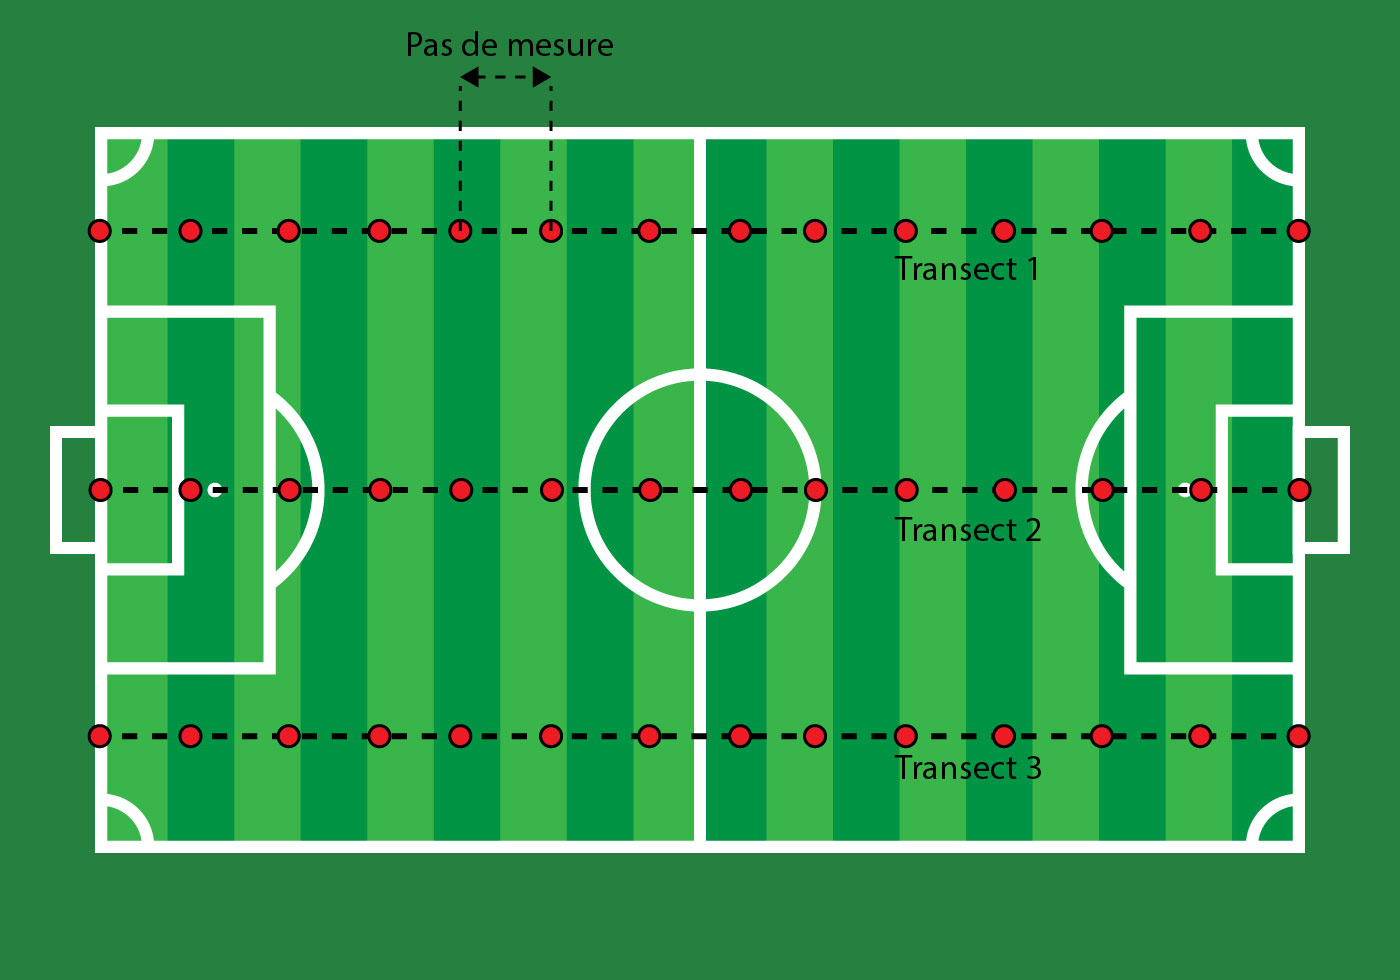
Measurements are realized on a grid sampling strategy made of 3 parallel lines with a fixed spacing between two points (see figure 1). For the standard series, spacing is 5 meters. For series of 20 and 105 measurements, spacing is 3 and 15 meters respectively. This grid sampling strategy has been set initially to take in account spatial variation of soil moisture in the field (geostatistic) and identify eventual tendencies with dry and wet areas in the pitch. For this study, the nonrandom strategy implies statistical bias that is important to mention. In a review made by Lawrence et al.1 in 2020 on soil sampling strategies, a similar bias was identified on data used for the study.
For the 64 available series, only data set with more than 60 measurements have been selected for this study. Method described by Micah Woods (in his article about the minimal number of soil samples to take for calcium concentration assessment) which was initially derived from the review from Lawrence et al. has been adapted and used for this data set.
The method consists of :
a) high number of random draws (1000 in the present study) made on sub-samples of each data set of more than 60 measurements. Arithmetic or geometric mean is then calculated.
Geometric mean is used if soil moisture distribution follows a lognormal law and arithmetic mean is used if distribution follows a normal law made on Lawrence et al. recommandations1. A Shapiro-Wilk statistical test has been used to assess if distribution or his logarithm was normal for each data set.
1000 pairs, triplets, quadruplets, until the full number of measurements n are therefore used from each data set and arithmetic or geometric means are then calculated.
The aim is to see what would have been the mean if 2,3,4, …, n-1 measurements would have been realized instead of total number n of measurements for each date.
Precision is fixed at 1% of soil moisture around the mean of n total measurements for each data set (mean of n total measurements +/-1%: all the points located in the rectangle formed by dotted lines in figure 2).
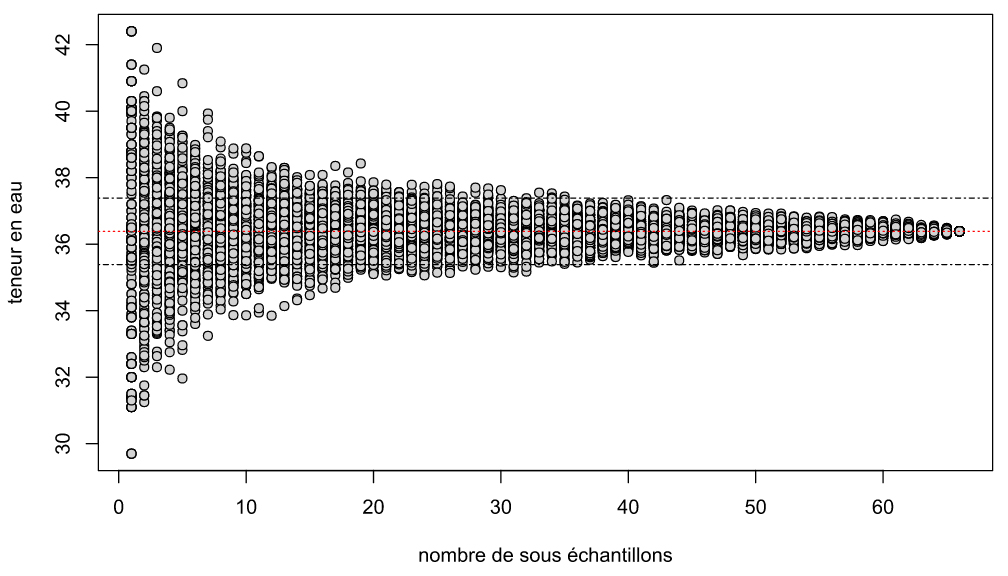
b) Means between this precision interval are then selected. Number of means in this precision interval is then evaluated for each sub-sample of 2,3,4, …, n measurements.
c) The number of sub-samples from which 95% of means are located in the precision interval (1% soil moisture around the mean of total number of measurements n) is then assessed (see figure 3). Precision is finally 1% soil volumetric moisture with an error of 5%.
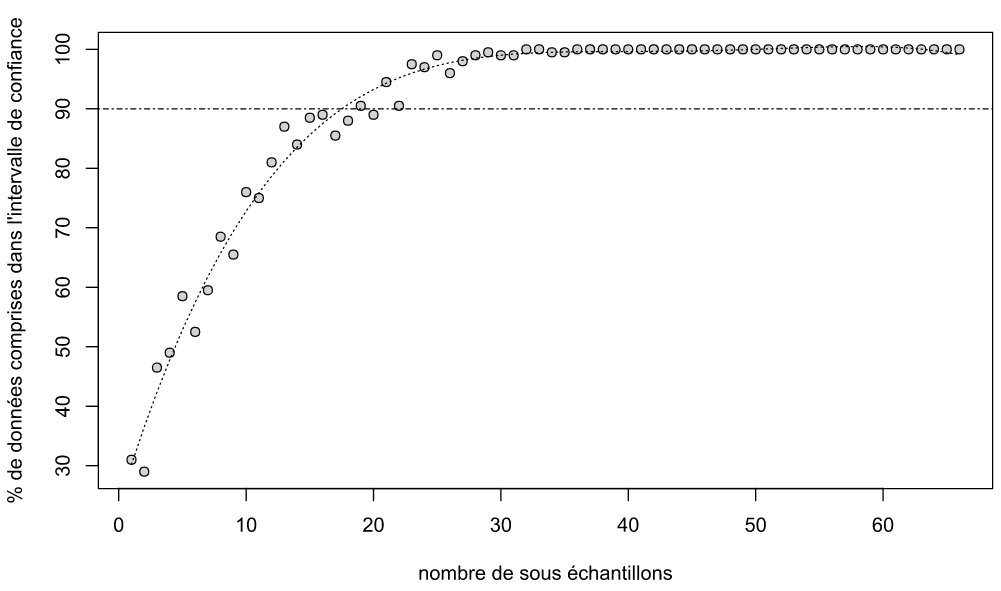
Steps a), b) and c) are repeted for each of 26 data sets.
The minimal number of measurements that would have been done to get the mean of total number of measurements is finally assessed for each date.
Mean, quartiles of these minimal numbers of subsamples are then calculated on 26 data sets and an interval of minimal number of measurements is estimated.
All statistical computing is made with R free and open source software.
Results
Soil moisture distribution
For Pogo Mini soil sensor, soil moisture distribution follows a normal in 80% of cases (see figure 4). Only 4 series do not follow a normal law. These series do not follow a lognormal law too. Arithmetic mean has been consequently used for all data sets.
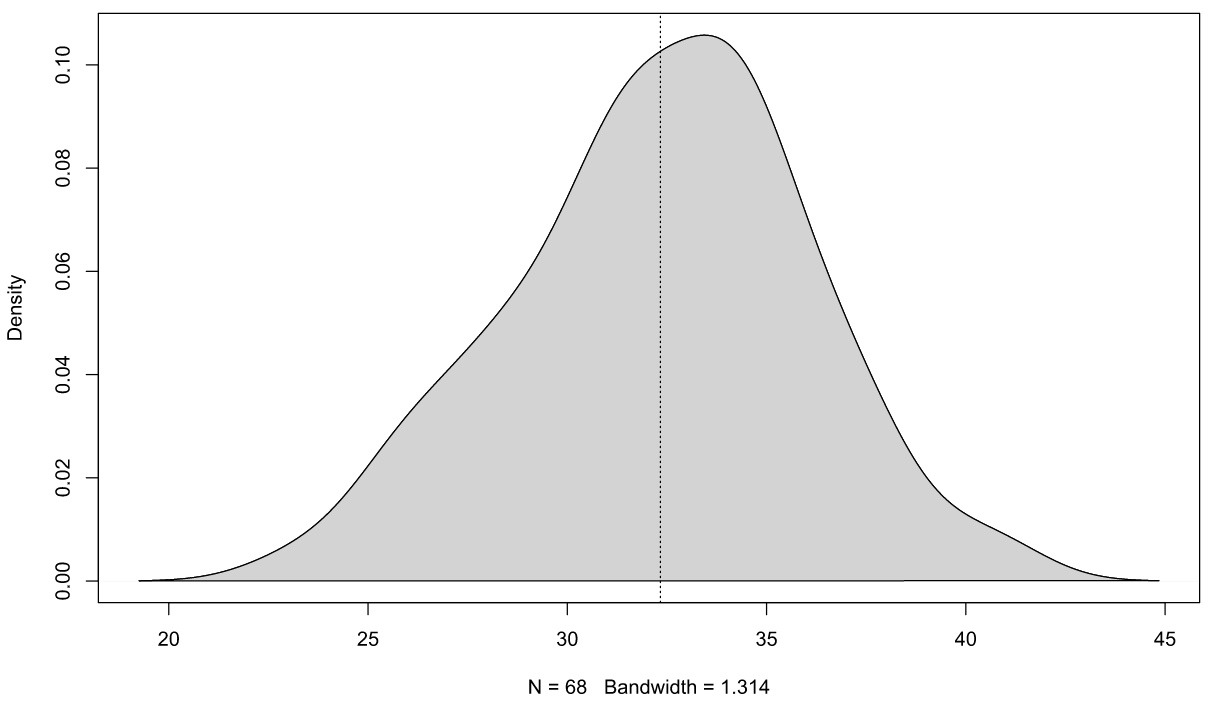
Observed cases where histograms which do not follow normal distribution are:
- Where the histogram peak corresponds to the mean but a non-negligible number of lowest soil moistures are present in the pitch which leads to an asymmetric histogram. This can be explained by an incorrect contact between probes and soil or by real localized dry spots. Influence volume of the Hydraprobe sensor of Pogo Mini is small and the probability to find located dry spots is higher (see the article concerning this subject here, unfortunately in French).
- Where a main peak is present in the histogram corresponding to the mean but a secondary peak is also present (histogram with two peaks). It can be the case in presence of anisotropy : when moisture depends on direction in the pitch (moisture higher in North than in South for example).
Minimal number of measurements to get a reliable mean
Statistics from minimal numbers of measurements get from each data set are presented in the next table. To summary, this number corresponds to the minimal number of measurements than should be done to get a mean closed to a high number of measurements (considered reliable) with a precision of 1% and a truth interval of 95%.
|
Statistical property |
Estimated minimal number of measurements |
Total number of measurements for the corresponding data set |
| Minimum | 17 | 62 |
| 1st quartile | 22 | – |
| Median | 24 | – |
| Mean | 24 | – |
| 3rd quartile | 27 | – |
| Maximum | 35 | 122 |
75% of means are between 17 and 27 measurements with a mean equal to median: 24 measurements. Consequently, with the POGO Mini sensor and AirFibr technology, it is statistically reliable to make between 22 et 27 measurements to get a reliable mean for the whole pitch. The mean get from this study (24 measurements) can be considered as the minimum number of measurements necessary to get a reliable mean for the whole
Eventual Bias between number of measurements and mean soil mositure/total number of measurements
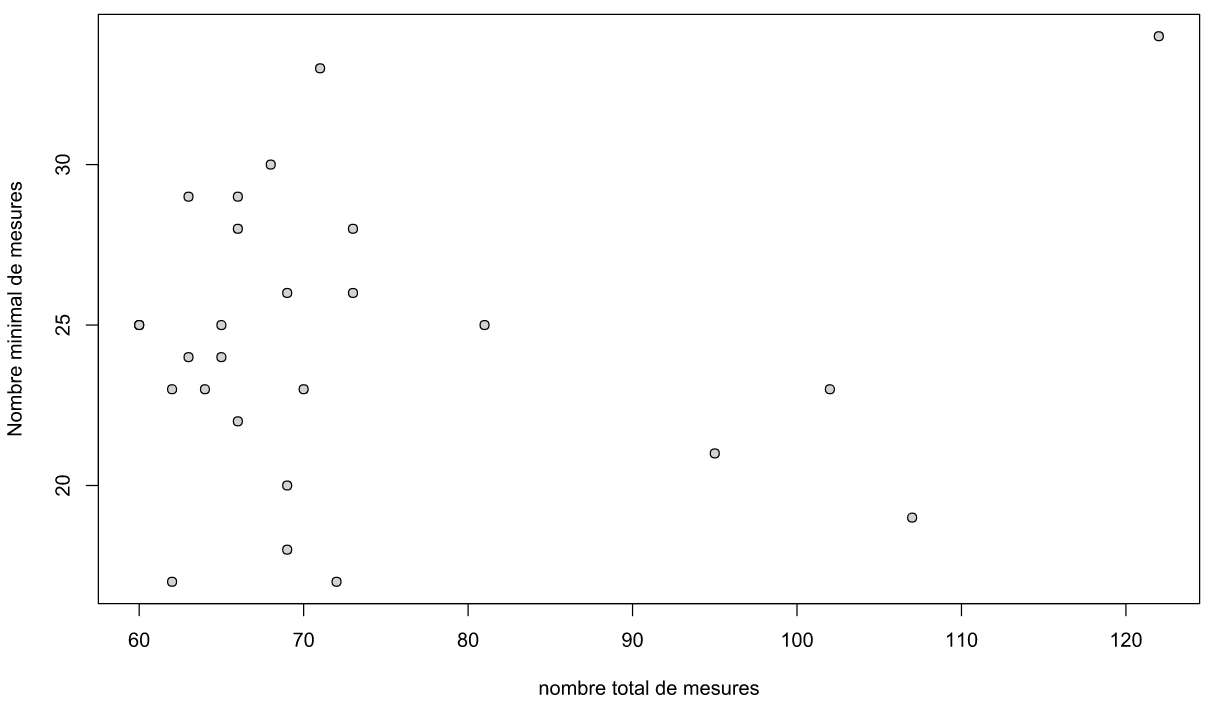
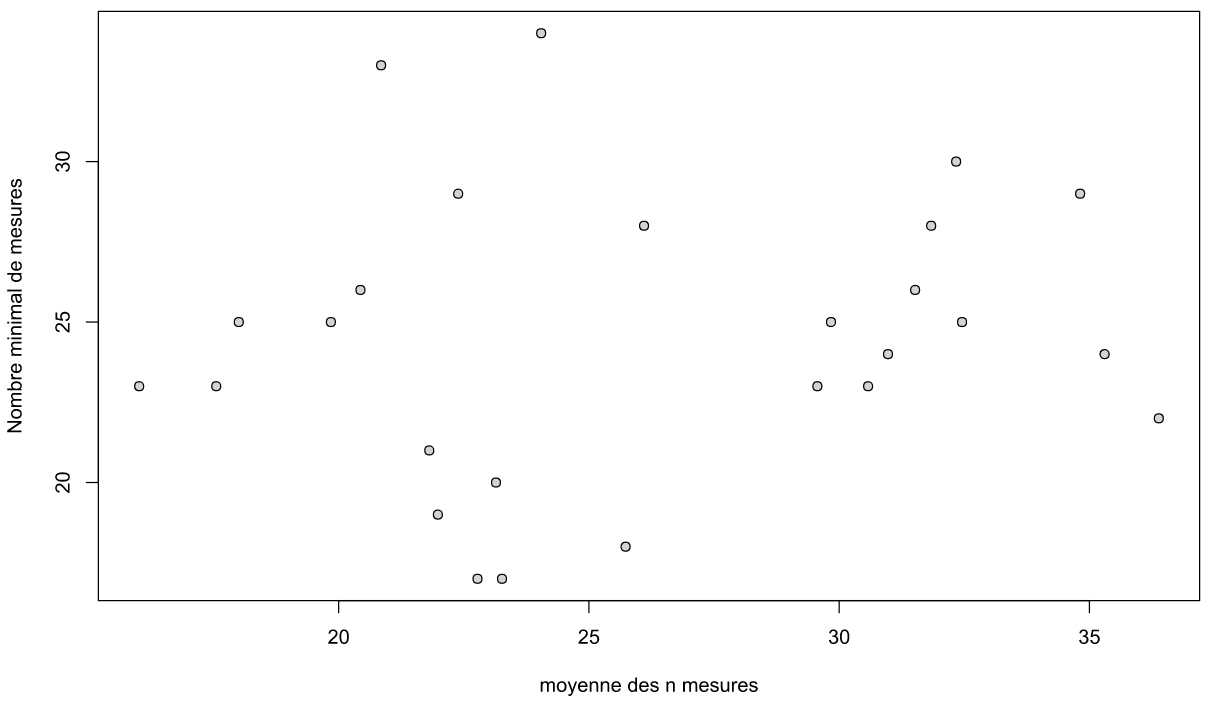
In order to assess if the minimal number of measurements is not biased by the total number of measurements or the mean moisture of the whole pitch, an correlation analysis has been made between the different parameters. Results show a apparent absence of correlation (see figure 5 and 6). Minimal values of precedent paragraph can consequently be used with reliability.
Conclusion & Discussion
On Airfibr hybrid technology, it is necessary to realize between 22 and 27 measurements to get a mean statistically reliable at the pitch scale with POGO Mini soil moisture sensor. Thereby, intendant can make 24 measurements to get a reliable mean that can be use in monitoring of the pitch for this type of pitch technology.
This conclusion is obviously valid with this soil moisture sensor model (Hydraprobe sensor used in the POGO Mini) and its small volume of influence. The study will be completed with other sensors that have higher volume of influence. These sensors will require probably less measurements to get a reliable mean, since the volume prospected is higher.
It is thus important to precise that this influence volume has a strong incidence on soil moisture mean. Actually, with smaller influence volume (like POGO Mini), results obtained would give without any doubt a true picture of the first centimeters of the soil. Everything depends on the rooting depth of turf during measurements which gives the volume explored by roots.
In this way, POGO Mini sensor could be useful during installation period of turf when rooting is shallow. On the contrary, this sensor has a tendency to be pessimist with mature stand of grasses with a deeper rooting and could lead to overwatering.
References
- Lawrence, P. G., Roper, W., Morris, T. F. & Guillard, K., 2020. Guiding soil sampling strategies using classical and spatial statistics: A review. Agron.j. 112, 493–510. https://doi.org/10.1002/agj2.20048


