


Foreword
The Agronomy Case Files is a series of field-based case studies built around real-world situations that have been investigated in depth. The objective is to share the lessons learned from these agronomic investigations and, hopefully, provide useful insights and practical guidance for professionals who may encounter similar challenges.
While the role of the sports turf manager has gained increasing recognition in recent years, that of the agronomist remains relatively unknown and is sometimes misunderstood. Through this series of articles, I hope to shed some light on this still uncommon profession within the turfgrass industry and illustrate how agronomy can help diagnose, understand and solve complex field problems.
The writing style and grammar may not always meet the standards of a professional author, but every effort has been made to produce a clear, accurate and enjoyable technical article.
Introduction
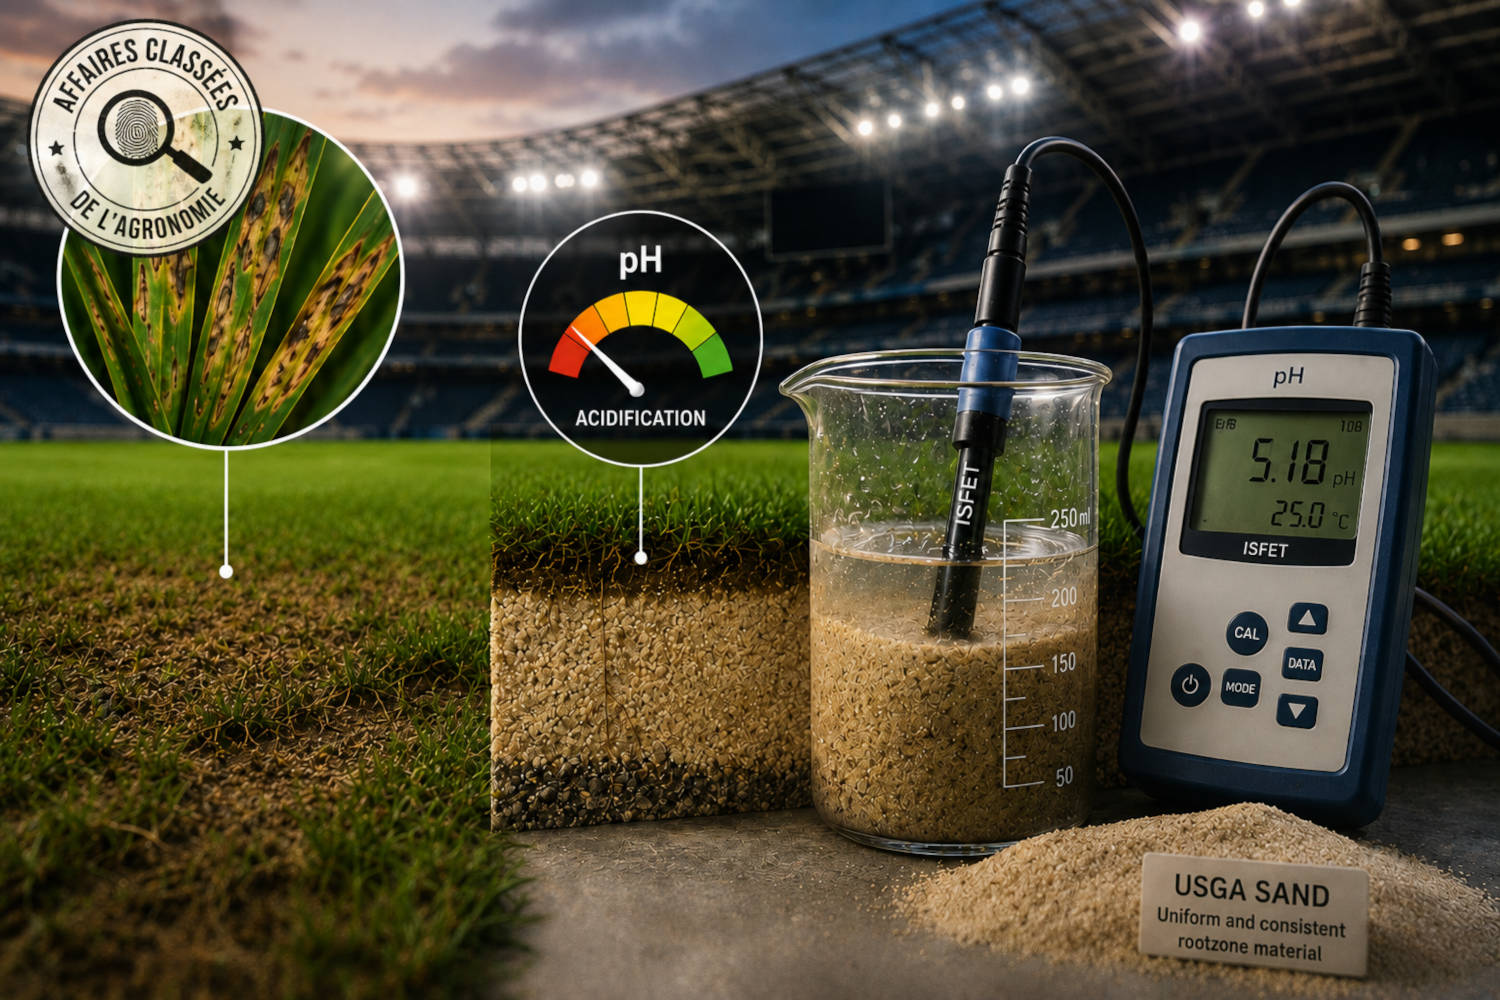
In this first edition, I examine a complex situation encountered in an elite football stadium with a closed architecture and a reinforced natural turf system (« lay-and-play » type) filled using a USGA-specification sand.
During the spring of 2026, two unusual phenomena were observed:
- A progressive decline in turf growth across the entire pitch compared with historical median growth values recorded under similar fertilisation programmes and temperature conditions.
- The development of Drechslera spp. and Bipolaris spp. (historically grouped under the convenient but scientifically imprecise term « Helminthosporium complex« ).
While reduced growth is not necessarily problematic as long as visual quality, surface stability and recovery between matches remain acceptable, the development of pathogenic fungi can have direct consequences on turf quality and appearance.
The occurrence of Drechslera spp. and Bipolaris spp. is relatively common on sports turf surfaces from autumn through spring whenever prolonged moisture coincides with low natural light levels. This explains why symptoms are often more pronounced in enclosed stadiums where light availability and air movement are limited, particularly in the southern and south-eastern sections of the pitch (Figure 2).
In practice, these pathogens are rarely catastrophic because symptoms generally remain confined to older leaves located beneath the actively growing upper canopy. Disease development tends to be slow, resulting in relatively low disease incidence and limited visual impact during TV events.
Site Assessment: Turf Growth Decline and Disease Development
At this stadium, turf growth is measured at every mowing event using the methodology described on Clinique du Gazon and recorded through NGPlatform, the monitoring application developed by Natural Grass. This approach makes it possible to monitor long-term growth trends and adjust fertilisation programmes accordingly.
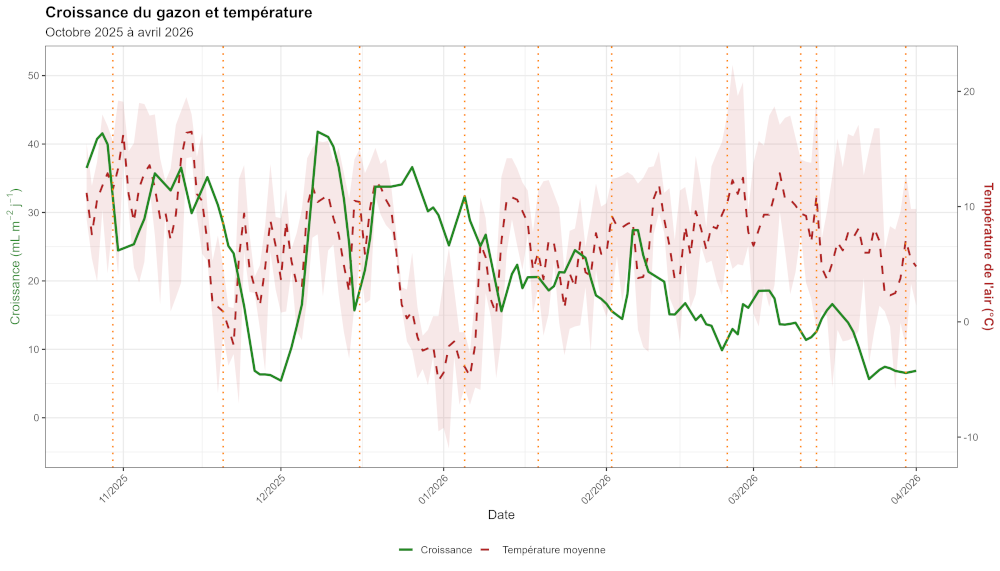
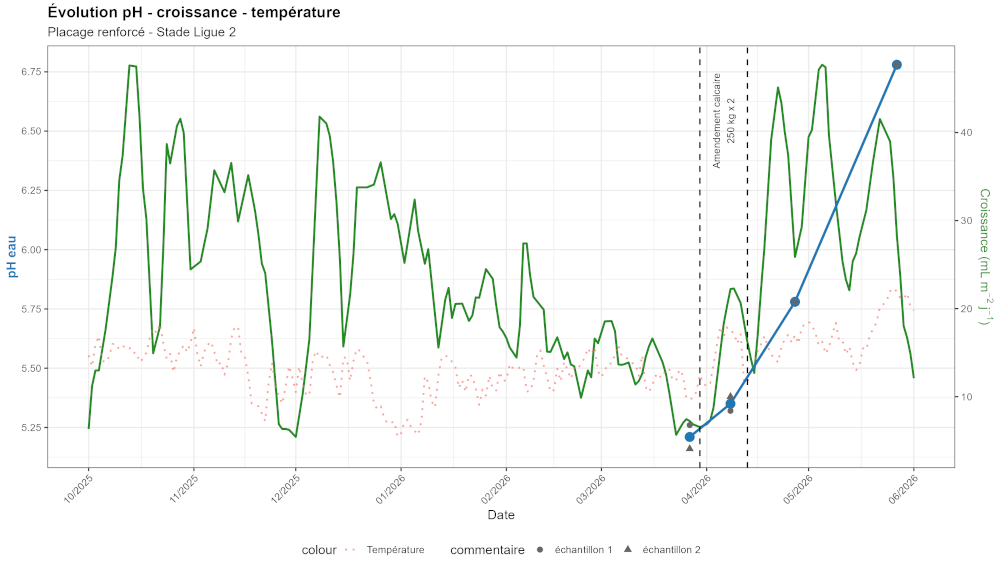
From late autumn 2025 through winter and early spring 2026, a gradual decline in turf growth was observed (Figure 1) despite:
- A standard nitrogen fertilisation programme considered appropriate for this type of surface.
- The regular use of artificial lighting rigs equipped with 1000 W HPS lamps.
- Soil temperatures maintained within a range normally capable of supporting acceptable winter growth.
- Relatively mild weather conditions, with very limited periods of severe cold. In fact, growth remained satisfactory during the only significant cold spell recorded during the season.
The progressive decline therefore clearly appeared to be abnormal.
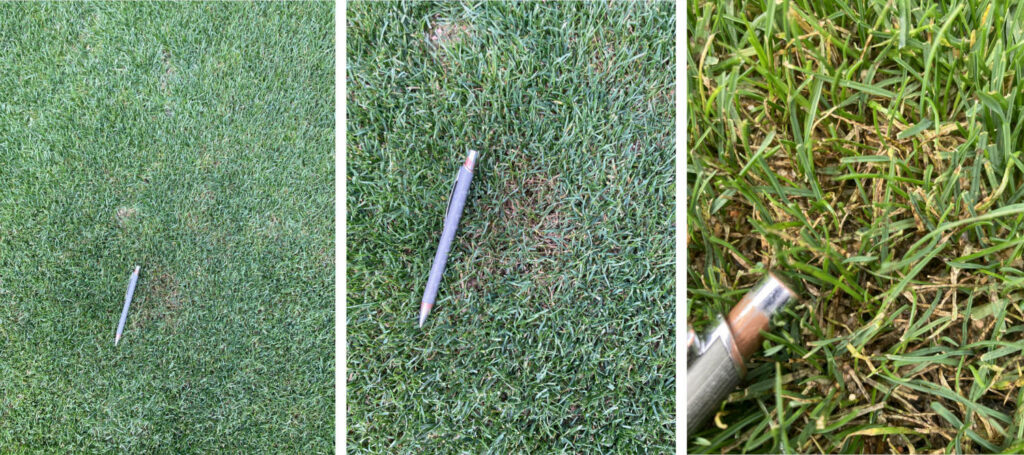
In addition, Drechslera spp. and Bipolaris spp. remained unusually active and persistent throughout the period, with little opportunity for effective suppression (Photograph 1). A detailed investigation was therefore initiated to better understand the underlying causes.
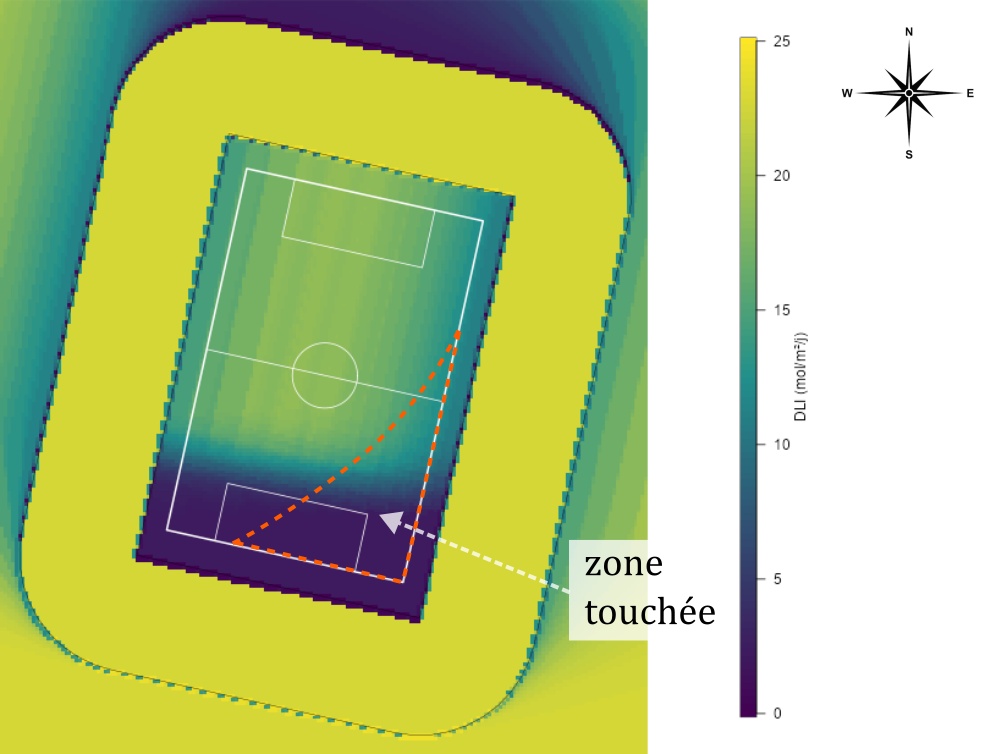
While reduced growth affected the entire pitch, disease pressure was concentrated in the southern and south-eastern sections, corresponding to the areas receiving the least natural light (Figure 2 and Photograph 1).
Regular NDVI measurements are also performed at this stadium in order to monitor turf density spatially (Figure 3).
Similarly, spatial measurements collected using a POGO sensor equipped with the Stevens Water HydraProbe allow the assessment of soil solute concentration through soil electrical conductivity (ECsoil) corrected for soil moisture (SM), generating a Salinity Index (SI):
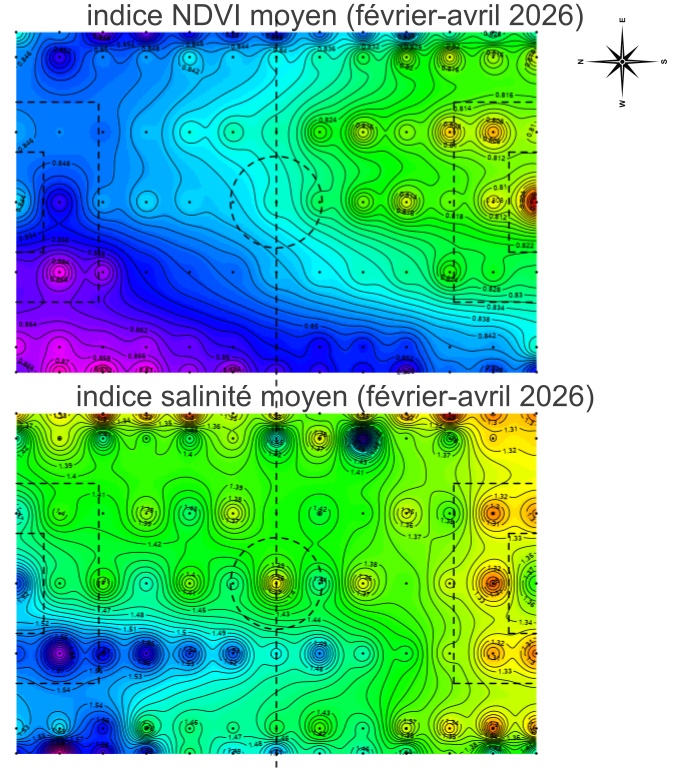
The NDVI maps clearly show maximum density levels in the north-western section of the pitch and minimum density levels in the south-east, where disease pressure was greatest. Although overall turf density remained acceptable, the pattern was highly consistent.
One particularly interesting observation was the spatial correlation between the Salinity Index and NDVI. This relationship suggested that rootzone fertility or nutrient availability might be involved in the observed decline.
Interestingly, such salinity gradients are frequently observed in stadium environments despite uniform fertiliser applications across the entire playing surface.
First Hypothesis: Phosphorus Availability
As agronomists, one of the first questions we ask when growth declines is whether nutrient availability may be limiting.
On hybrid pitches constructed almost entirely from USGA sand, nutrient concentrations can fluctuate significantly over time. However, frequent fertiliser applications generally prevent major deficiencies. In addition, secondary nutrients such as calcium, magnesium and micronutrients were regularly applied preventively on this site.
Among all nutrients, phosphorus appeared to be the most plausible candidate. Phosphorus inputs were intentionally limited within the fertiliser programme because phosphorus accumulates relatively efficiently in sports turf rootzones and may encourage annual meadow-grass (Poa annua) seedhead production.
A soil analysis was therefore performed on the sand-based turf layer, initially considered to be the primary rooting environment.
Understanding the System: Why Rootzone Structure Matters
Before interpreting the results, it is important to understand the physical structure of the system.
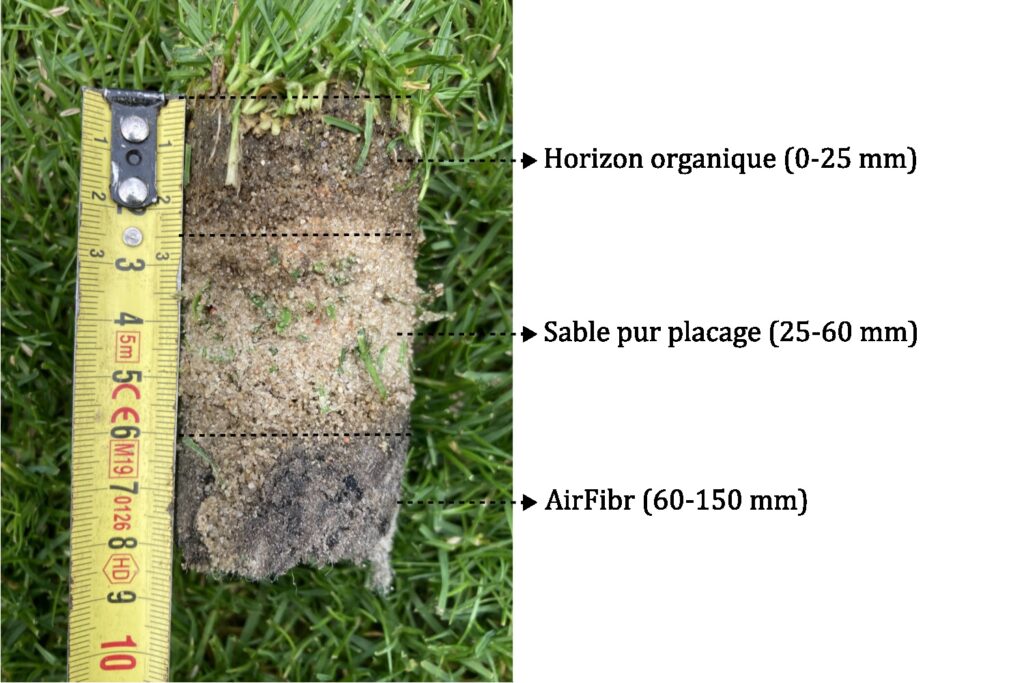
The reinforced turf layer consisted of 3 to 4 cm of USGA sand-based sod installed over approximately 15 cm of AirFibr hybrid rootzone material (Photograph 2).
Because AirFibr possesses finer particles and stronger capillary properties, roots tend to colonise the upper surface of the AirFibr layer without penetrating significantly deeper.
By the second year after installation, repeated sand topdressings combined with organic matter accumulation had created a distinct organic surface horizon approximately 20–25 mm thick. While the original sod sand contained only about 0.4% organic matter, the upper horizon likely contained several percent organic matter.
Under these conditions, most microbial activity and nutrient cycling occur within the upper 2–3 cm of the profile. The turf undoubtedly obtains some nutrients from the deeper sand layer, but nutrient availability there is likely much lower, as confirmed by analyses performed during late winter.
The AirFibr layer itself primarily functions as a water reservoir.
Phosphorus Analysis
The phosphorus analysis carried out on the turfing sand layer produced the following result:
- OlsenPhosphorus: 15 mg/kg
Based on the database I have built for hybrid sports turf systems, this concentration is relatively low but does not indicate a clear phosphorus deficiency. In my experience, phosphorus deficiency symptoms generally become apparent below approximately 10 mg/kg Olsen P, particularly considering that this profile originally consisted of pure USGA sand with no organic amendment.
Furthermore, the upper organic-rich horizon is almost certainly more concentrated in plant-available phosphorus than the underlying turfing sand. Consequently, it was not clear that phosphorus applications were actually required.
Nevertheless, to verify this hypothesis, two phosphorus applications were made during the spring, representing approximately 150 kg P₂O₅/ha in total. No significant response was observed, either in turf growth or in disease development.
Ultimately, phosphorus proved to be a false lead: concentrations may have been moderate, but they were not limiting.
Hypothesis 2: Soil Acidification
Background
Having encountered similar situations in the past, the second major hypothesis investigated was substrate acidification.
Through various mechanisms—including intensive use of granular fertilizers combined with the inherently low buffering capacity of sand-based systems—soil pH can gradually decline over time.
A chemical analysis of the turfing sand layer, which still represented approximately 60% of the rooting volume, showed a soil water pH (pHwater) close to 7, which is considered optimal for cool-season turfgrass.
This is where the profile structure illustrated in Figure 3 becomes particularly important.
When conducting soil analyses, the organic thatch layer is often removed because it can dramatically increase measured nutrient concentrations while representing only a small proportion of the total profile depth. Indeed, laboratories typically recommend sampling depths between 5 and 10 cm.
However, in this case, the upper organic horizon accounted for approximately 40% of the total rooting volume, making it impossible to ignore.
Since the necessary equipment was available, I therefore conducted my own pHwater measurements following a protocol very close to the ISO methodology used by accredited laboratories. The method was calibrated with the sod sand layer and produced results nearly identical to those obtained from laboratory analyses.
Measurements were performed on the 0–25 mm organic horizon in two distinct areas of the pitch:
- the North-West zone, which was little or not affected by Drechslera spp. and Bipolaris spp.;
- the South-East zone, which showed the most severe disease symptoms.
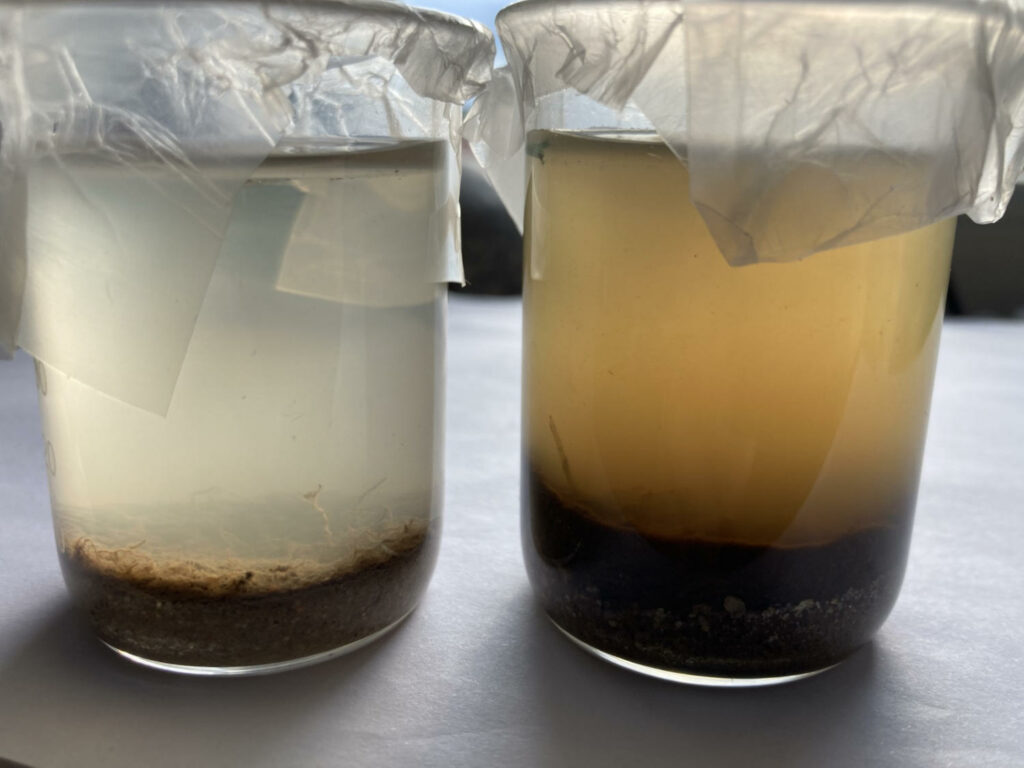
Numerous subsamples were collected within each zone and combined into composite samples. The samples were subsequently dried before pH measurement using distilled water.
Diagnosis
The results were quite clear.
Within the most severely affected area (South-East), at the peak of disease development—which also coincided with the lowest recorded growth rates—the pHwater of the 0–25 mm organic horizon was measured at 5.1.
At this level of acidity, the availability of several essential nutrients, particularly macronutrients and secondary nutrients, begins to decline significantly (Figure 4). In addition, aluminium becomes increasingly soluble and may reach concentrations capable of inducing phytotoxic effects.
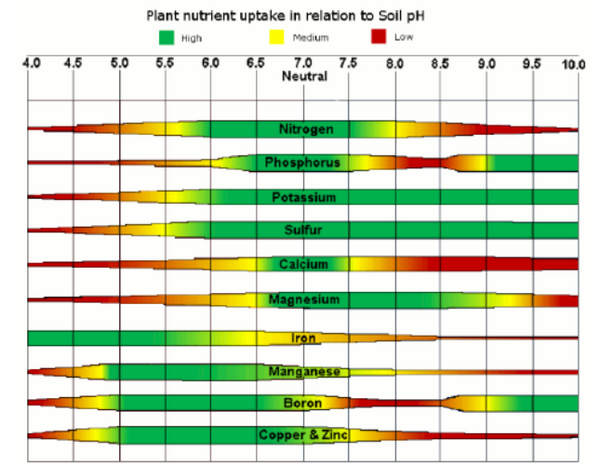
It is important to remember that, under the profile configuration described previously (Photograph 2), a substantial proportion of nutrient uptake likely occurs within this shallow organic horizon, which itself represents more than 40% of the effective rooting volume.
An acidic pH reducing nutrient availability could therefore directly affect turfgrass growth and reduce tolerance to pathogenic fungi, providing a plausible explanation for the observed symptoms.
In the less affected North-West area, the pHwater of the same organic horizon measured 5.5. Although slightly higher than in the South-East, this value remains sufficiently acidic to negatively affect turfgrass performance.
However, this zone also receives substantially more sunlight, resulting in greater photosynthetic activity and all the associated physiological benefits, including reduced plant stress. Increased solar radiation also promotes faster leaf drying, reducing leaf wetness duration and creating less favourable conditions for fungal development.
This likely explains why growth reduction was observed across the entire pitch, whereas severe outbreaks of Drechslera spp. and Bipolaris spp. remained largely confined to the South-East sector.
Testing the Acidification Hypothesis
Since this hypothesis appeared credible and could be monitored through measurable indicators, the next logical step was to test it experimentally:
If soil acidity is indeed responsible for the observed problems, increasing soil pH should result in a gradual recovery of turf growth and a reduction in symptoms associated with Drechslera spp. and Bipolaris spp.
To raise substrate pH, two applications of a granular limestone amendment were carried out approximately one month apart (late March and late April), each at a rate of 250 kg per pitch.
The product contained:
- 42% CaO
- 2.5% MgO
- Neutralizing value: 43
- Minimum 85% passing an 80-micron sieve before granulation
- Carbonic solubility: 55
Because the horizon requiring correction was relatively shallow (20–25 mm), a reasonably rapid response could be expected without the need for large or repeated applications.
Results
Raising soil pH is a relatively slow process in natural soils, although it occurs more rapidly in weakly buffered media such as USGA sands. Consequently, it took approximately one month before the first measurable effects were observed, with soil pH increasing to 5.7 on April 27.
While statistically and agronomically significant, this increase was not yet sufficient to produce a clear effect on turfgrass growth or disease development. It took approximately six to eight weeks, with soil pH reaching 6.8 on May 27, before growth returned to an optimal range and symptoms of Drechslera spp. and Bipolaris spp. became almost undetectable in the South-East area.
The results are presented in Figure 5. A prolonged decline in turf growth can first be observed despite favourable temperatures, followed by a clear recovery after the limestone applications and the gradual increase in soil pH.
To quantify density differences between the two opposite areas of the pitch, weekly NDVI measurements were averaged separately for each zone. This produced Figure 6, which illustrates the evolution of NDVI in both the North-West and South-East sectors.
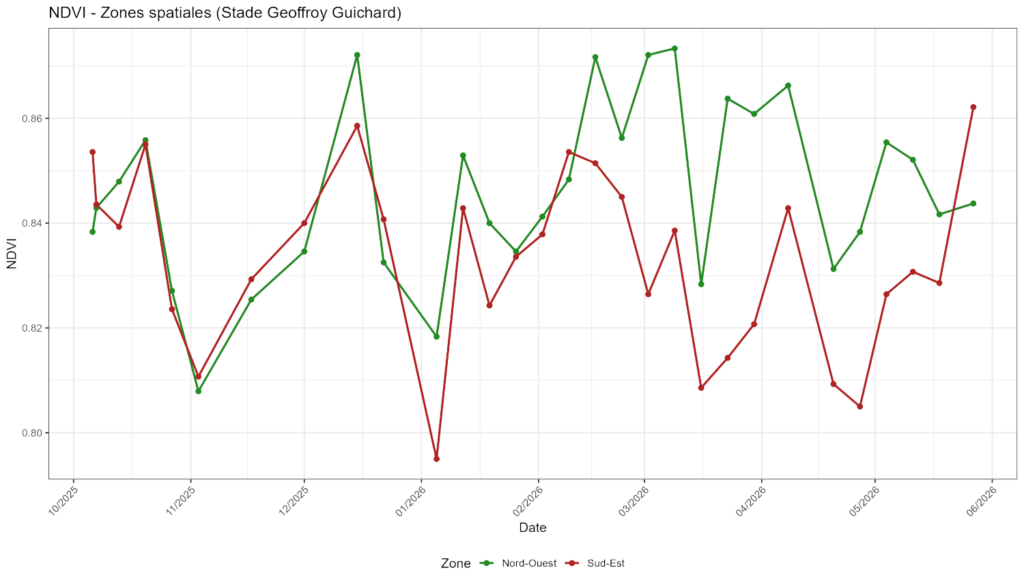
To improve readability, a simple index was calculated as the difference between NDVI values measured in the two areas:
The higher the index, the greater the density difference between the two zones. A value of zero indicates comparable density levels, whereas negative values indicate higher density in the South-East than in the North-West.
This latter situation occurred following the warm weather experienced in May, when the North-West section became increasingly exposed to solar radiation and started to experience heat and moisture stress.
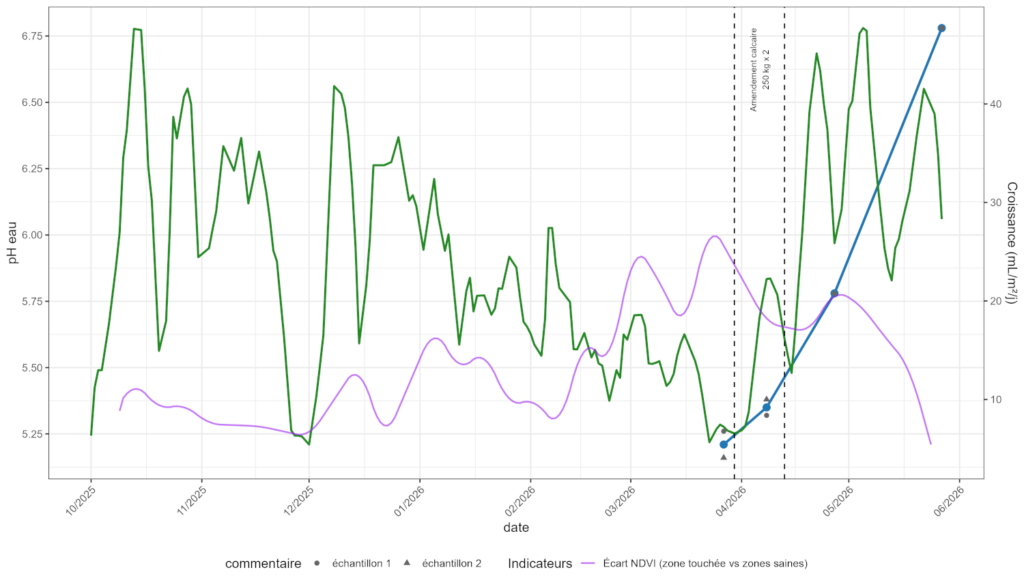
Figure 7 summarizes the results using this new density differential index (purple curve).
The density gap progressively widened as growth declined, reflecting the increasing contrast between the North-West sector (less affected by Drechslera spp. and Bipolaris spp.) and the South-East sector (most affected). Following the first limestone application, the density differential began to decrease steadily and eventually reached zero by the end of May, indicating similar turf density in both areas.
Following the two limestone applications, the increase in pH within the upper 0–25 mm layer resulted in restoration of normal measured growth rates, a marked reduction in symptoms associated with Drechslera spp. and Bipolaris spp. and a restoration of acceptable visual quality in the South-East sector.
The timing of the response strongly suggests that the limestone applications represent the key turning point in the system.
Photograph 4 provides a visual illustration of turf density following the second limestone application.
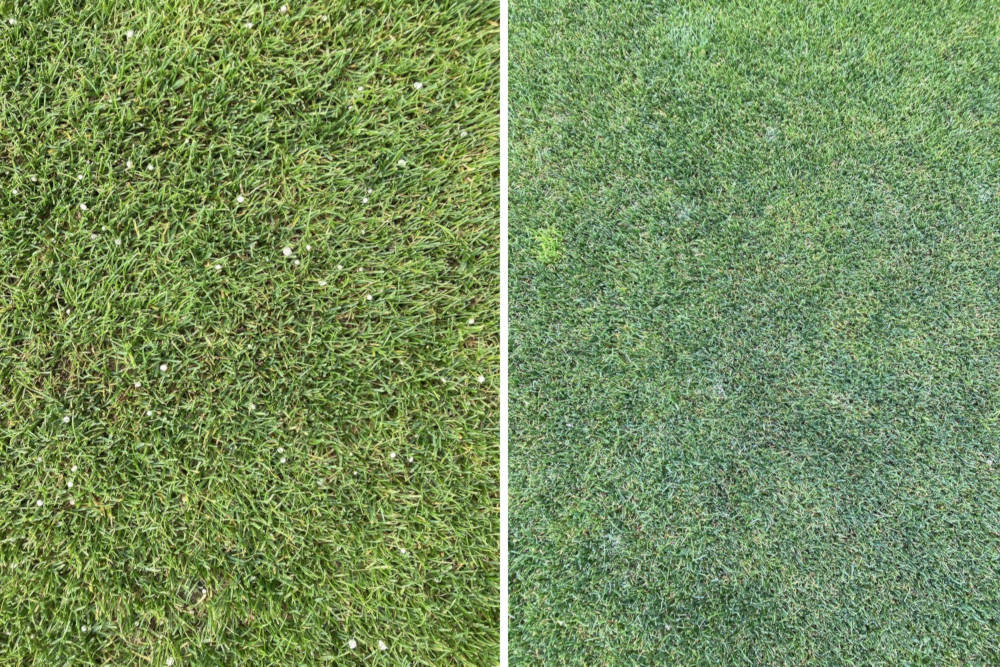
Photograph: R. GIRAUD. Licence: Clinique du Gazon, all rights reserved ©
Conclusion
This case study illustrates how agronomic knowledge and measurement tools can provide powerful leverage for understanding and solving issues that may significantly affect playing surface quality.
Observation skills, meaningful measurements and the selection of appropriate indicators are essential components of a robust diagnostic process and the implementation of effective corrective actions.
In this particular case, numerous explanations could have been proposed to explain the observed decline. Some would likely have resulted in inappropriate interventions, potentially expensive and, in certain situations, detrimental to turf quality.
Without measurements and without a solid historical database capable of distinguishing normal behaviour from true anomalies, this type of issue can persist for extended periods and ultimately create extremely challenging situations for turf managers.
Beyond the practical aspects of this case, the objective was to demonstrate that in enclosed stadiums where light availability is significantly restricted, progressive substrate acidification—particularly within the upper organic horizon—can lead to reduced turfgrass growth and promote the development of Drechslera spp. and Bipolaris spp. in the most shaded areas.
Reduced availability of major and secondary nutrients, combined with the likely onset of aluminium toxicity, creates physiological stress that progressively limits turf growth potential and increases susceptibility to opportunistic pathogens such as Drechslera spp. and Bipolaris spp.
Conversely, areas receiving greater sunlight benefit from higher photosynthetic activity and carbohydrate production, reducing plant stress and shortening leaf wetness duration. Both factors likely contribute to lower disease pressure and improved turf performance.
Ultimately, this case serves as a reminder that disease outbreaks are not always primarily pathological problems. In some situations, they may simply be symptoms of an underlying agronomic imbalance that requires identification and correction before any sustainable improvement can be achieved.


